AcaPlt
A MATLAB package for academic plotting.
Installation
The installation is extremely simple. Just download the AcaPlt.m file from the GitHub repository and add the directory where it locates into your Search Path.
Usage
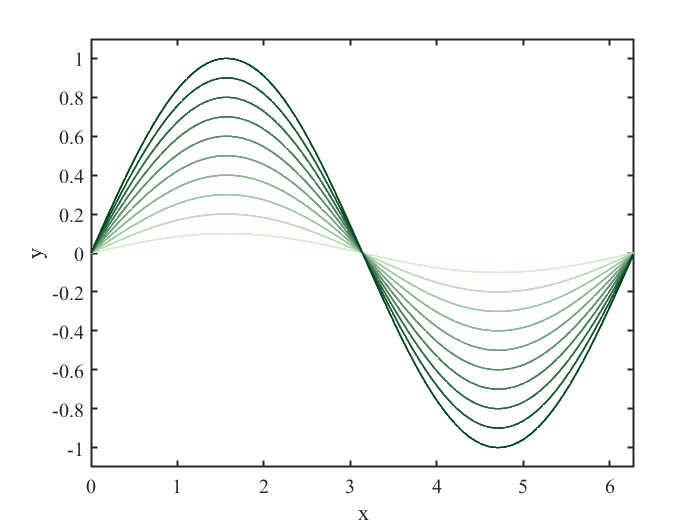
Now it includes two basic functions for creating a plot, AcaPlt and AcaPlt/subplt, which are similar to MATLAB’s built-in function figure and subplot respectively; and three functions for plotting, AcaPlt/plt, AcaPlt/errbar and AcaPlt/mdplt. AcaPlt/plt and AcaPlt/errbar are similar to plot and errorbar respectively but are able to produce more beautiful figures which are also more suitable for academic publication. The function AcaPlt/mdplt allows one to plot multiple data at one time, whose color can easily be set as gradient.
Simple Example
1
2
3
4
5
6
7
8
9
10
 x = 0:0.01:2*pi;
y = sin(x)' * linspace(0.1, 1, 10);

f = AcaPlt;
f.subplt(1, 1, 1);
f.mdplt(x, y, 'ig');

xlabel('x');
ylabel('y');
axis([0, 2*pi, -1.1, 1.1]);
The script above generates
